
Map of earthquake and aftershocks in Haiti. Credit: USGS
This image from the USGS shows all the seismic activity in the region, including areas in the ocean.
Dennis Mileti, also from CU-Boulder said three factors contributed to the severity of the Haitian event: the shallow location of the earthquake (only 8.3 kilometers or 5.2 miles underground) resulting in high shaking intensity; the low-quality construction of structures in the area; and the lack of earthquake preparedness and increased vulnerability resulting from Haiti being a poor country.
The epicenter of the earthquake was just 15 kilometers (10 miles) southwest of the Haitian capital of Port-au-Prince. Besides its strong magnitude, the earthquake’s shallow depth ensured that the densely populated capital would suffer violent shaking. More than 30 aftershocks rocked the area.
Reports say a majority if the infrastructure has collapsed, including schools, hospitals, government buildings – such as the presidential palace and the main prison — aid centers, and shantytowns.
The top map shows the region surrounding the 7.0-magnitude earthquake and the aftershocks. Earthquake magnitudes are measures of earthquake size calculated from ground motion recorded on seismographs.
Ocean areas appear in shades of blue, and land areas appear in shades of brown. Both in water and on land, higher elevation appears in lighter colors. Black circles mark earthquake locations determined by the USGS, and circle sizes correspond with quake magnitudes. Black lines indicate fault lines.
The map was created using earthquake and plate tectonics data from the USGS Earthquake Hazard Program, elevation data from the Shuttle Radar Topography Mission (SRTM) courtesy of the University of Maryland’s Global Land Cover Facility, and ocean bathymetry data from the British Oceanogprahic Data Centre’s (BODC) General Bathymetric Chart of the Oceans (GEBCO).
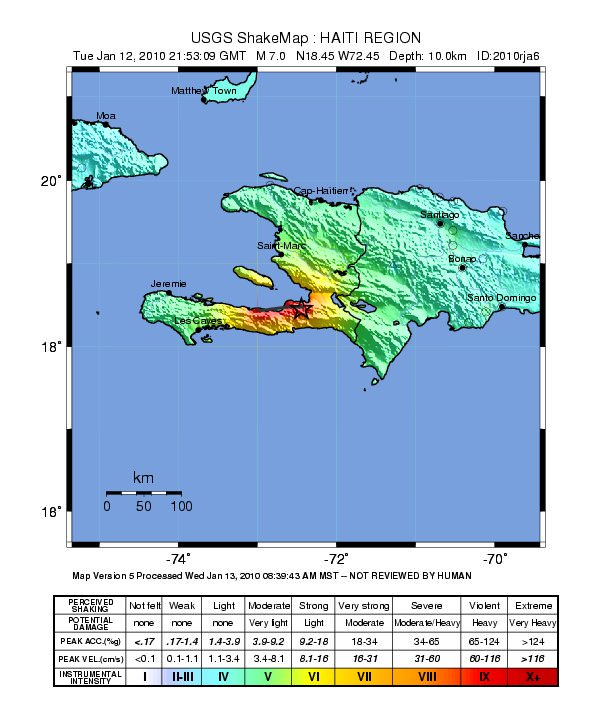
This "shake" map from the USGS shows the intensity of shaking felt across the region in Haiti.
The USGS said the earthquakes occurred along the boundary between the Caribbean and North America plates. This area is characterized as a strike-slip fault where the Caribbean plate moves eastward with respect to the North America plate.
But Haiti wasn't the only place an earthquake has taken place recently. Check out this intriguing map of earthquakes in the past week.
Source from : http://www.universetoday.com/2010/01/13/map-of-earthquake-and-aftershocks-in-haiti/


 ...)
0 comments:
Post a Comment